Query OXFORDIA
This page is for researchers who want to run analyses across the OXFORDIA federation from R.
Prerequisites
- R with the
oxfordiaandsolidauthrpackages installed - A WebID issued by your institution's OXFORDIA identity provider
- The dataset URLs for the partner institutions you want to query (provided by their data administrators)
- A Statistic Access Rule at each partner site that authorizes your WebID for the statistics you want to run
Installation
Or install from the project repository:
remotes::install_github("OXFORDIA-project/oxfordia-r")
remotes::install_github("OXFORDIA-project/solidauthr-r")
Step 1: Authenticate
Authenticate once. Your WebID credential is presented automatically to every node you query.
Replace the idp URL with your own institution's identity provider.
Step 2: Declare target sites
List the datasets you want to query. Each name is an arbitrary label; each value is the dataset URL provided by the partner site's data administrator.
targets <- oxfordia_targets(
  oxford    = "https://oxfordia.med.ox.ac.uk/cohort/nemaline",
  hacettepe = "https://oxfordia.hacettepe.edu.tr/cohort/nemaline",
  partner3  = "https://oxfordia.partner3.edu/cohort/nemaline"
)
Step 3: Run a query
The query is dispatched to all target sites in parallel. Each site independently checks your identity and access rules, executes the query locally, and returns an aggregate result. The R client combines per-site results into a single global answer.
Mean
result <- oxfordia_mean(
  targets    = targets,
  auth       = auth,
  graph_path = "BaselineAge"
)

result$value    # 21.6309888889  — global weighted mean
result$n        # 180            — total participant count
result$per_site # tibble with columns: site, mean, count
Kaplan–Meier survival analysis
result <- oxfordia_kaplan_meier(
  targets       = targets,
  auth          = auth,
  time_path     = "EventTime",
  event_path    = "EventOccurred",
  stratify_path = "GeneticGroup"   # optional
)

plot(result)   # federated survival curve, grouped by GeneticGroup
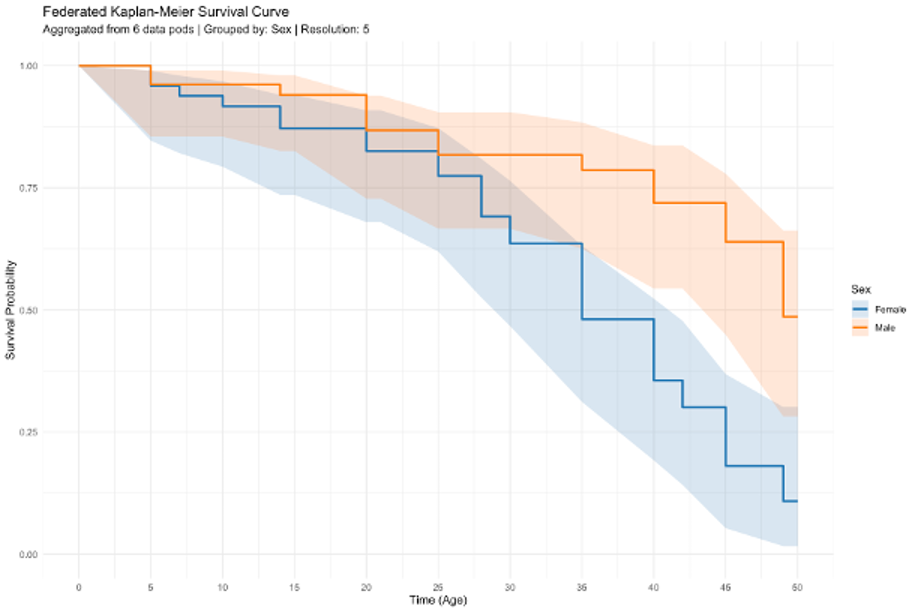
The plot() method produces a survival curve aggregated across all responding sites, with optional confidence intervals and stratification.
What happens behind the scenes
- The R client builds an aggregate query and dispatches it to each target node.
- Each node verifies your identity using your WebID token.
- Each node loads the Statistic Access Rules applicable to you and the requested graph path, and checks whether the query is permitted.
- If authorized, the node executes the query against its local triplestore.
- After execution, the node checks result-level constraints (e.g.,
minCount). If the constraint fails, that site returns no result. - Each site returns its local aggregate result and a count (the weight used for combining).
- The R client combines per-site results — for means, a count-weighted average; for Kaplan–Meier, a pooled curve.
If a site rejects your query (because no matching SAR exists, or minCount was not met), that site is omitted from the combined result. result$per_site shows you which sites contributed.
Handling partial results
Not every site in your targets list will necessarily respond or authorize every query. Check result$per_site to see per-site breakdown and identify any sites that did not contribute.
result$per_site
# A tibble: 3 × 3
#   site      mean     n
#   <chr>    <dbl> <int>
# 1 oxford    22.1    60
# 2 hacettepe 20.8    40
# 3 partner3  21.9    80
Available graph paths
Graph paths are defined by the Data Plugin installed on each node. For the Nemaline plugin, the available paths are:
| Path | Description |
|---|---|
BaselineAge |
Age at enrollment |
EventTime |
Time to event or censoring |
EventOccurred |
Event indicator |
GeneticGroup |
Genetic subgroup |
Ambulation |
Ambulatory status |
TotalMFM |
Total MFM score |
If a node does not have the required Data Plugin installed, or if your WebID is not authorized for the requested path, that site will return a rejection.